Infographic

Energy Poverty – Infographic
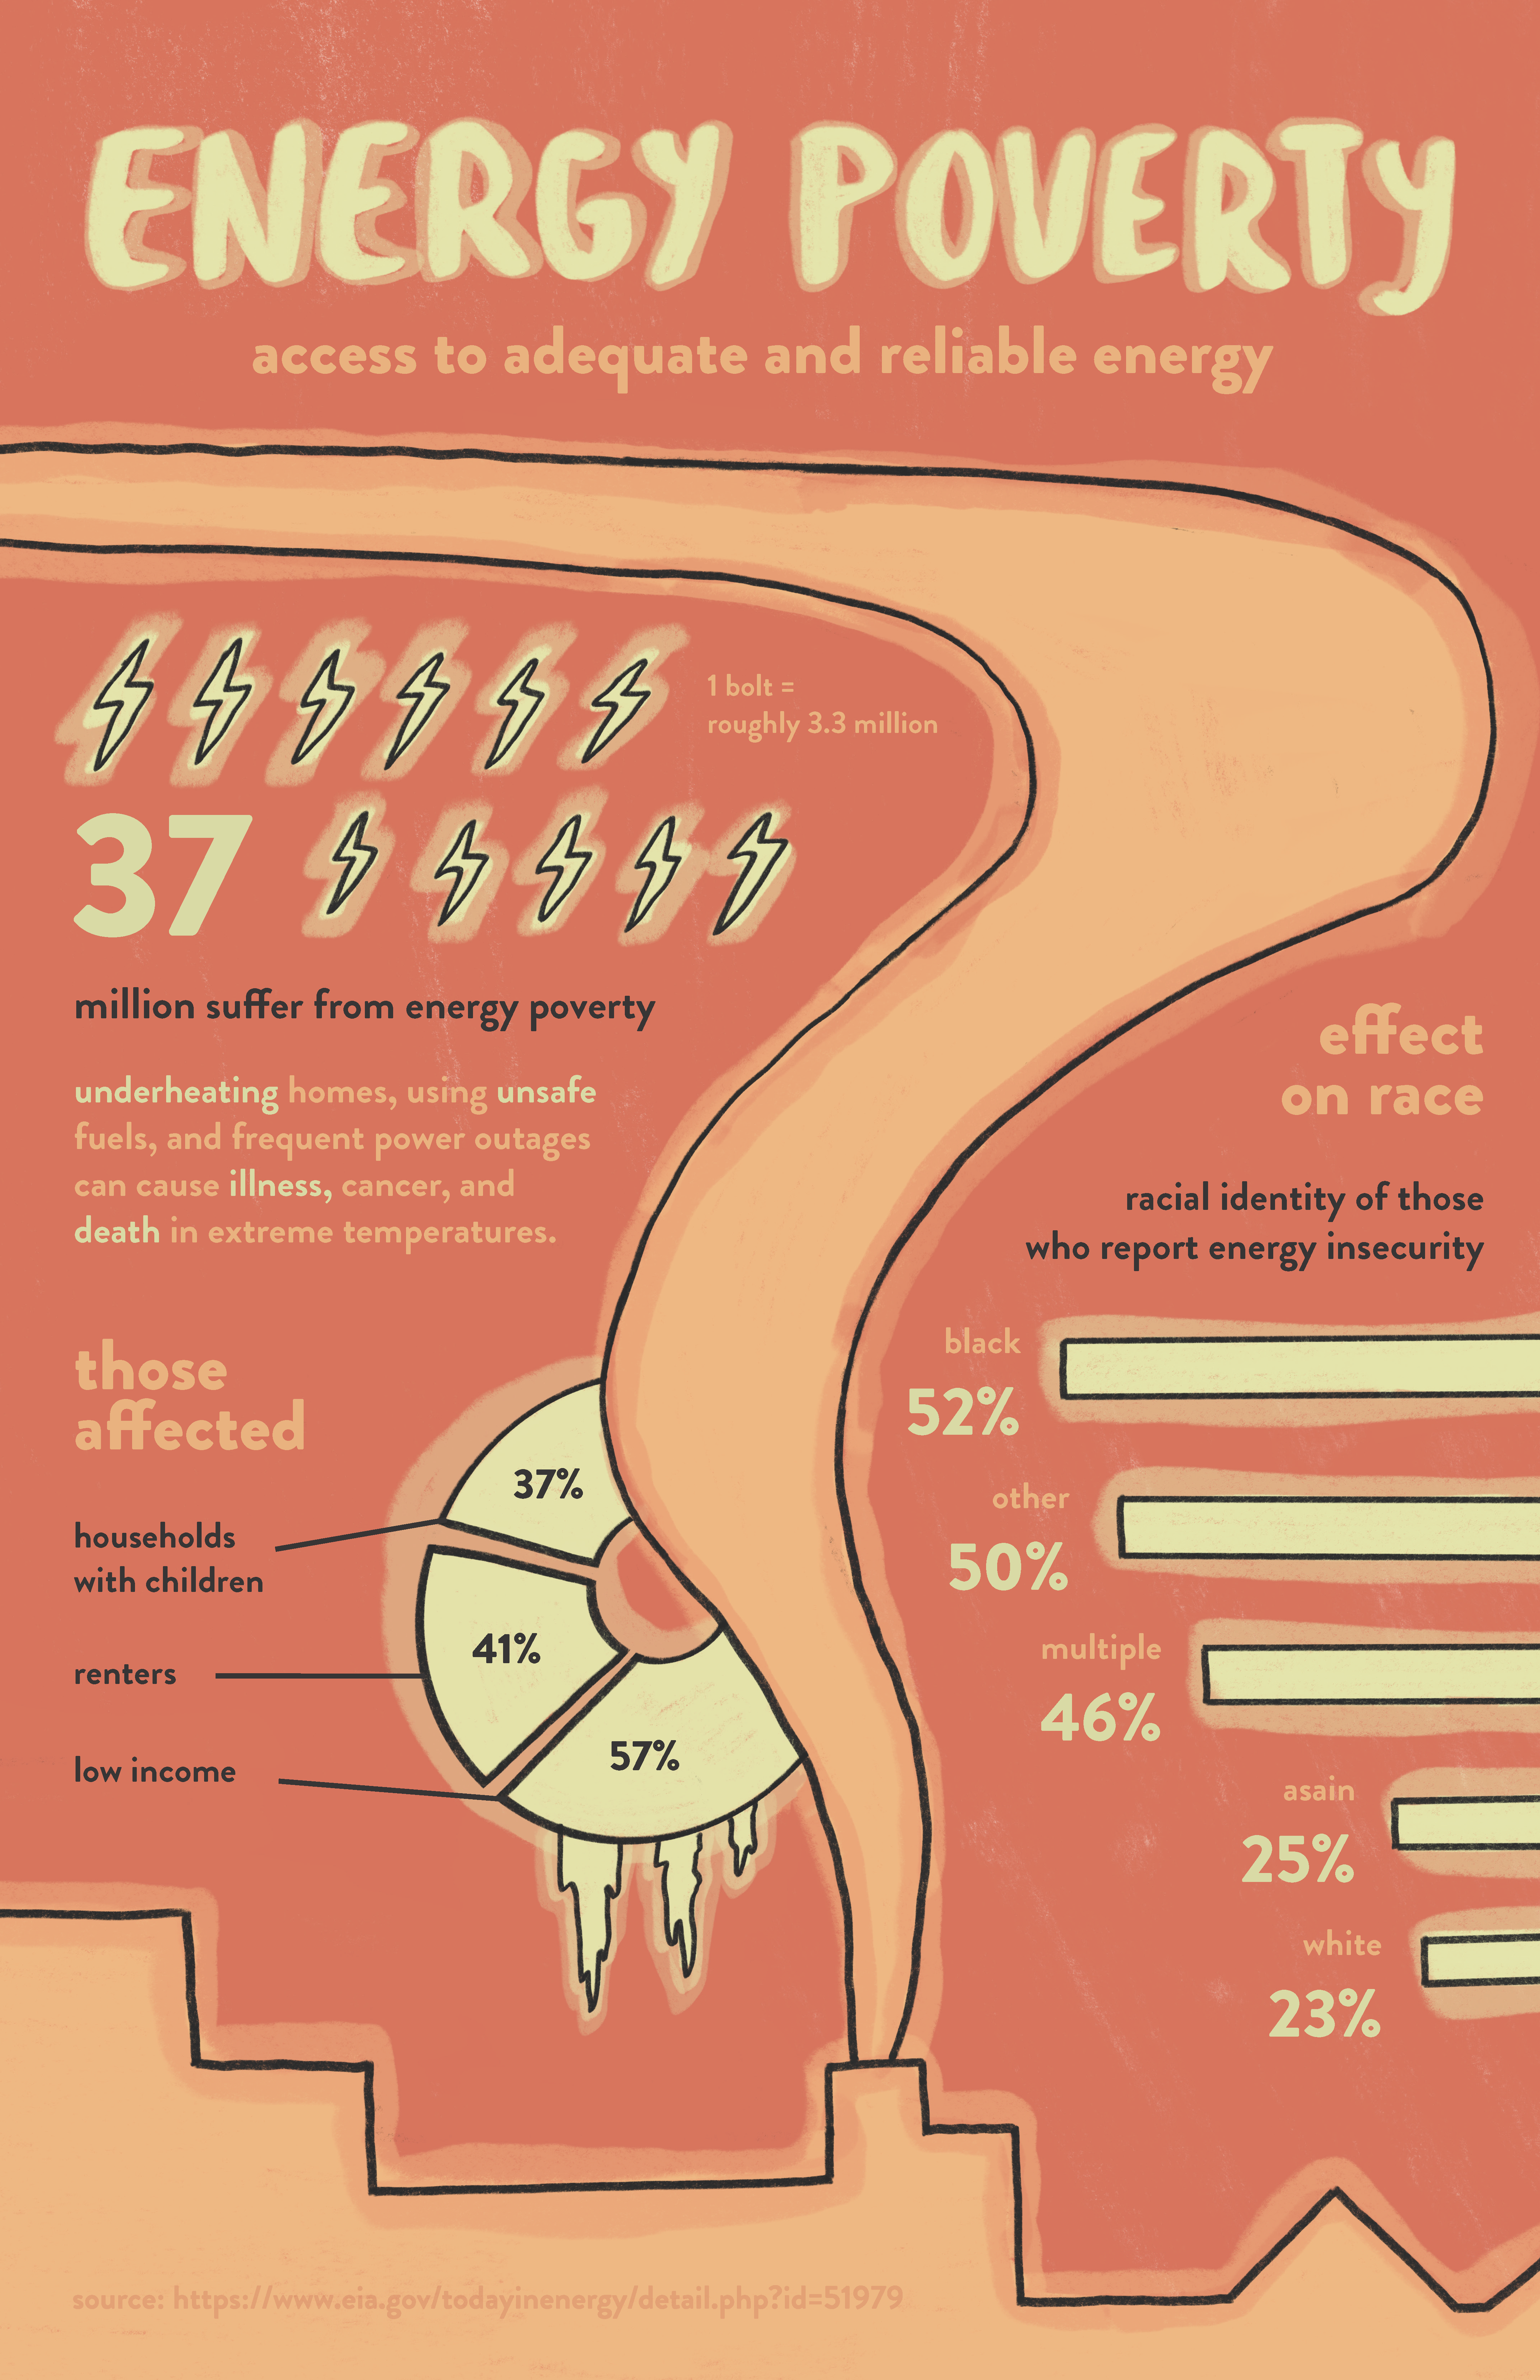
Infographics are a visual images such as charts or diagrams to represent information or data. This particular infographic was on the topic of energy poverty. Energy poverty occurs when a household has to reduce its energy consumption to a dangerous level.
For this infographic the information that needed to be highlighted includs how many people it affects, who is affected, and how it effects them. Large numbers are important on this infographic as well as unique and relevent visual graphs and charts.
